
There are a ton of companies that have sprouted up in recent months talking about how they are an “Agentic AI SOC Platform” (and plenty of older companies as well who have changed their marketing to match). The promise is real — instead of needing to have a team of highly paid and specialized employees constantly trawling through network and security logs to hunt for threats and incidents, that task can be handed to a machine using AI instead. Not only does that drastically reduce the cost of this extremely valuable activity, but it also makes it available for smaller businesses and home users who might not be able to otherwise afford that level of vigilance on their network.
After getting a demo of a number of these AI SOC tools, one thing just kept hitting me again and again: all I’m paying for is a harness. These tools simply hook into or replace existing infrastructure (log sources and collectors, network topology and diagrams, DNS and firewall logs, etc) and then provide a mechanism for an LLM with a crafted system prompt to examine that dataset on a regular schedule. Some claim to have a specially trained model they use, but in most cases it just seems to be an Anthropic API key behind the scenes.
Two thoughts came to me simultaneously. First, an annoyance that I’m really just paying an exorbitant fee for some basic plumbing and a system prompt. And second, that I could probably build this myself.
So I did.
Version 1.0: JBOP (Just A Bunch Of Prompts)
I like Open-WebUI. I’ve got a version of it running in a docker container in my home, routed through Cloudflared to make it accessible beyond my home firewall (behind an IAP, of course). I’ve found that it provides an excellent platform for noodling with LLMs and what they can do, allowing access to all kinds of tools through MCP connections and even the ability to hook up a sandboxed container for extra fun.
Thanks specifically to that function called OpenTerminal where Open-WebUI can directly control a docker container I was able to allow the AI agent running within the platform to do things like create and run python code, make network calls, and interact with other systems in my network. Specifically I had already installed a PiHole DNS filter and a LibreNMS deployment where logs from all of my systems are shuffled, so I already had all the right sources to be able to grab the necessary data and do some threat hunting.
Working with the AI, I was able to generate a system prompt for the agent as well as an initial prompt that would kick off a threat hunting session every day within my network. Using skill files and an attached MCP for sending email notifications, I was able to get it to successfully build out all the required components every day and run the analysis, giving me back a pretty solid report.
For the curious, here are the exact files (redacted, of course) that I used to set up that quick and dirty version:
https://github.com/foghorn/dawnpatrol/tree/main/docs/old-prompts
And, it worked! Mostly. There were some issues that I wanted to address.
The first issue is persistence. The way I configured OpenTerminal with Open-WebUI meant that it was configured as an ephemeral docker container running alongside the main Open-WebUI container. This gave me some peace of mind, since I was continuously wiping the container and starting from scratch. Any oddness or nasty packages that the AI would install would simply be wiped out in short order.
The downside to that choice is that the scripts needed for the agent to pull the logs and analyze them from the various sources needed to be generated every single time the agent ran. I couldn’t depend on them being on disk, and I also couldn’t depend on the results being available in a given directory. I probably could have solved this by mounting a volume to persist that data within the container, but that would have violated the principle I was relying on of this being a dumb ephemeral container for safety purposes.
Which brings me to problem number two. Normally this system worked as intended — the python scripts were stored in the prompts and skills themselves, and the AI just needed to write them to disk and run them. But it didn’t always do exactly that. Sometimes it tried to improvise and improve, usually ending up with additional problems that needed to be fixed along the way before getting to the true task at hand.
That also meant that the output was never quite right and never really consistent. Some emails were spot on, others had formatting issues. I had left it to a skill to define the parameters for the email and I noticed it took three or four tries sometimes to get the email right.
Another side effect: the credentials were stored in the skills themselves. Without the ability to have environment variables to pull from for these functions, and for the purposes of just getting this running, I stored the full API keys and tokens in the skills themselves. Not the brightest idea, for sure. No one else was using this instance but me really so this was generally fine, but not ideal and could have led to some serious problems if the system was ever compromised.
Which leads me to the biggest problem. This thing was EXPENSIVE! The overhead of having to build all these files, write them to disk, perform the up front analysis, store it in the system somewhere… I could see the costs being acceptable for a small business, but as a personal use kind of thing I can’t be spending $25 a day just for it to continuously find nothing. I wanted to use the Opus 5 model to allow for better threat hunting capabilities, but in the end I could only afford to use Haiku 4.5.
In the end, while this worked, it was expensive, fragile, and not extensible. Adding a new source or tweaking something was a longer process than I’d like with unpredictable results. I also wanted to get this off my Open-WebUI instance just for durability and cleanliness reasons — it was a good test bed, but now that I had proven the concept and gained the experience needed to actually build something useful it was time to turn to Claude Code and try to turn non-deterministic slop into vibe coded consistency.
Version 2.0: DawnPatrol
If I can get on my soapbox for a second, in my opinion the best way to use AI coding assistants is to use your brain and your experience to define an architecture at a high level for whatever you are building, give the agent that description alongside the goals and objectives of what you want, and let it run. That’s the way that I used Claude Code in creating this system, and for the majority of what you see in the final project this was essentially “one shotted” into existence from a single prompt and then refined to its current state.
As a starting point, what I wanted at the end of this process was a docker container that was self sufficient and could perform this analysis without any outside intervention. It should run at a set time every day, pull all the details it needs, use deterministic code (I didn’t even specify a language) to do some rough analysis, and then provide tools to an AI agent that operated within the container to dig deeper and do some proper threat hunting against what was going on.
Digging a little deeper, I also kind of wanted to make something that the next time an “Agentic AI SOC” vendor came up and tried to pitch me their product I could point to a simple open source tool and ask the question “what do you do for me that I can’t get here for free?”
From an architectural standpoint, I also wanted this to be something that could be easily extended and enhanced. If I found a new domain name reputation API that I liked I wanted to be able to slot that in without a lot of fuss. Or if I had a new source for log data, to be able to quickly add that to the system without needing a full re-write. I liked the way that WordPress and some other systems handle plugins, where there’s a folder that they get dropped into, and as long as the files are properly formatted it just gets added to the runtime of the application. I wanted Claude to do the same thing here, where every component of the system could be defined in a script that is added to specific folders.
I also wanted this to be able to be used with any AI provider, not just Anthropic. I’m using LiteLLM at home to proxy a couple instances of Ollama on various computers running open weight models, and I wanted to be able to hook those up once I got things running to keep costs down even further. Ideally the AI should only be doing the threat hunting parts, so the overhead should be significantly less.
I took all those hopes and dreams, dropped them alongside the existing MD files for the agent I had already built, and let Claude get to work. The result is DawnPatrol.
https://github.com/foghorn/dawnpatrol
One addition I made after working with it for a bit: I also added an MCP server to be able to interact with the results from an agent in Open-WebUI. If it flagged something I could use that MCP to pull the data into an agent, which I could control from my phone, and has access to a wide array of tools to investigate further.
How It Works
A security operations center works because someone reads the logs every morning. Most home networks and plenty of small offices have the telemetry — a firewall, a DNS resolver — and none of the analyst. DawnPatrol is that analyst: a single container that wakes up before you do, reads everything your network did overnight, and leaves one report in your inbox.
Configuration: two files, and only two
Everything DawnPatrol needs lives in two places, and neither of them is code.
.env holds the operational settings — credentials, endpoints, your schedule, your budgets. Roughly four dozen variables, nearly all with sensible defaults, grouped into schedule, paths, database, AI provider, sources, enrichment, and outputs. Every secret also accepts a _FILE variant pointing at a path, so Docker and Podman secrets work without a wrapper script.
A few of those knobs do more work than the rest:
- Schedule. A cron expression and a window. Leave the cron empty and DawnPatrol runs once and exits — exactly what you want for testing, or for driving it from an external scheduler.
- Database. SQLite by default, with nothing to configure. Set both a host and a user and it switches to MySQL automatically. The override is credential-driven, so there’s no flag to forget.
- Retention, split by cost. Bulky raw events age out in a week. A narrow long-term slice of DNS and flow records — a few bytes per row, no payload — persists for six months. That slice is what makes retrospective hunting possible when an indicator surfaces next month.
- Model provider. Claude by default; point
DAWNPATROL_AI_PROVIDERatopenai_compatibleand a base URL and you’re running against Ollama, LM Studio, vLLM, or LiteLLM instead. One environment variable, not a code change. - Budgets. An effort level (low through max) plus hard ceilings on dollars, tool calls, and turns.
config/profile.yml describes your actual network — and this is the file that earns its keep. It’s data, not documentation. You define zones (CIDR ranges with a trust level, optional gateway, and expected egress domains), hosts (an IP, a name, a role), policy, and known quirks.
Every one of those fields changes what DawnPatrol does. Zones are resolved at normalize time, so an analyzer can say “an untrusted segment reached an unexpected destination” without a single address appearing in the source tree. Declaring your approved_resolvers turns any host resolving DNS elsewhere into a high-severity signal — its name resolution is no longer being observed. Listing a segment under nat_attribution_limited_behind makes the report say “from behind the gateway” instead of confidently naming a device it cannot actually see. And known_quirks gives you somewhere to write down “this router firmware mislabels routine roaming chatter as emergency severity” once, so it’s never rediscovered as a finding again.
The profile is gitignored; a fully commented template ships in its place. Nothing in the source tree contains an address, hostname, or credential — which is what makes the repository publishable.
There is no third file. Plugins enable themselves when their required environment variables are present. There’s no registry to edit and no ENABLED_PLUGINS list to keep in sync, so a plugin can’t quietly exist without being wired up. dawnpatrol list-plugins shows you what’s on, and what each disabled one is still waiting for.
How a run works
Eleven stages. Exactly one of them calls a model.
- Plan. Resolve the run window, load the profile, open the database, pull yesterday’s baseline.
- Collect. Every enabled source runs concurrently. Each one owns its own pagination quirks and retention limits — a source that can only serve 24 hours declares that, and the framework clamps its window and records it as a known limit rather than a shortfall.
- Normalize. Everything maps into one flat event model — firewall drops and DNS queries in the same shape, with source and destination zones resolved from your profile. That single decision is what makes cross-source correlation possible at all: the “IoT device bypassing the resolver” finding only works if a firewall event and a DNS event agree on what a source address means.
- Verify. Integrity gates per source: does the unique count match the reported total, does the time span cover the window, did anything come back at all? Each source lands in one of four health states. Critically, a source returning zero rows automatically triggers its own differential probes before being classified — so a malformed query is marked suspect, and only probe-confirmed silence is marked failed. A broken query can never be reported as “monitoring is blind.”
- Persist. Events are written to a per-run database; the long-term entity baseline — first-seen dates, occurrence counts for every IP, domain, and host — is updated. This is what makes novel-domain detection a real database query rather than a diff against something the model wrote yesterday.
- Analyze. Seven analyzers reduce the night to metrics and signals: firewall volume, pattern classification, DNS anomalies, beaconing, per-segment review, cross-source correlation, and baseline delta. Analyzers are pure functions over the event store — no network, no model calls — which is why they’re fast to iterate on and trivially testable against fixtures. A night’s ~300,000 raw events becomes a few dozen dense, numeric signals.
- Investigate. Now the model gets involved. It receives the evidence bundle and a read-only toolkit: schema inspection, genuinely read-only SQL against the run database, raw event samples backing any signal, metric and entity history, and budgeted reputation lookups. Open SQL rather than canned queries is deliberate — it lets the agent chase a hypothesis it forms mid-run without anyone having to anticipate the question. Safety comes from the connection being read-only, single-statement, timed out, and row-capped, not from asking the model to behave. It returns structured findings, never prose formatting.
- Adjudicate. Every finding is validated before it’s allowed into a report. Findings must cite a real analyzer signal. Reputation alone can’t create one. Severity can’t exceed its strongest supporting signal by more than one level. Critical requires local evidence of compromise, not an external score. Country is never a severity input. Active suppressions are matched and moved to an appendix — never silently deleted. Then the overall status rolls up.
- Render. Plaintext, markdown, HTML, or JSON, from shared renderers. The model never writes a heading, a number, or the report envelope — all statistics come from the metric objects the analyzers produced, so every number in the report traces to code by construction.
- Deliver. Every enabled output, each with its own policy. Email defaults to daily, because silence is indistinguishable from a dead agent. Webhooks default to important only, because a channel that pings every morning gets muted. Before anything ships, the rendered report is scanned for your configured secrets — a match aborts delivery.
- Checkpoint. Persist the run summary, metrics, findings, and watchlist for tomorrow; purge by retention.
Every stage writes a structured record, so a failed run is debuggable without re-running it. And run --stop-after analyze executes the whole pipeline except the model call — full evidence bundle, zero API spend. That’s how you develop detections.
Proving it was actually looking
A pipeline that reports all-clear for 200 consecutive days is indistinguishable from one that’s silently broken. So every run injects synthetic activity into reserved documentation ranges and asserts the analyzers catch it. Your report header reads Detection self-test: 2/2 canaries detected. A failed canary is itself a critical finding — because it means every green since the last successful check is unverified. Canary events are analyzed in an isolated pass, so they never touch a reported statistic.
Tweaking and extending
Five plugin folders — sources, analyzers, enrichment, outputs, and providers — each with a TEMPLATE.py to copy. Drop in a file, set its variables, and it discovers itself. Adding a third telemetry system or an eighth detection is one new file, not a rewrite.
Day to day, you run it: re-render a stored report, list recent runs, check the last self-test, hunt an indicator back six months, or suppress a false positive — with a mandatory expiry, because a pattern you tuned out in March may have changed character by June.
And when a report says something worth chasing, DawnPatrol speaks MCP. Flip one variable and it exposes a small, mostly-read-only, bearer-authenticated tool surface: read past reports, query the same guarded SQL, pull metric history, read the network profile, or trigger a fresh scoped analysis right now. It’s a second door onto rooms that already exist — the same runner, the same SQL validator, the same report files. Nothing there can email anyone or reach a destination DawnPatrol wasn’t already reaching. It’s the one component that listens, so it’s off by default.
DawnPatrol In Action
Let me give you a real world example of how this was able to identify something interesting and allow me to drill into it.
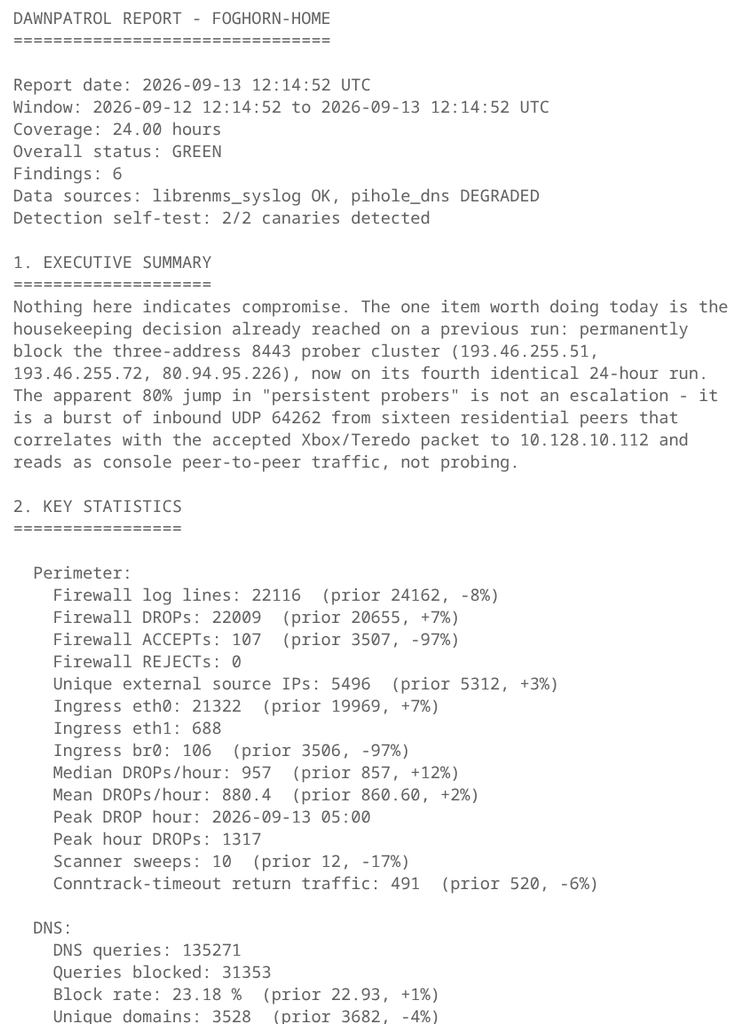
The other day I got this generated report from DawnPatrol in my email inbox (it goes on for a bit, this is just the excerpt at the top). It was highlighting that there was a single inbound ACCEPT connection from the internet — something a little strange, since nothing should be coming in from the internet. It provided a reasonable explanation, but I wanted more confirmation.
I then switched over to an agent on my Open-WebUI interface to ask more questions about it.
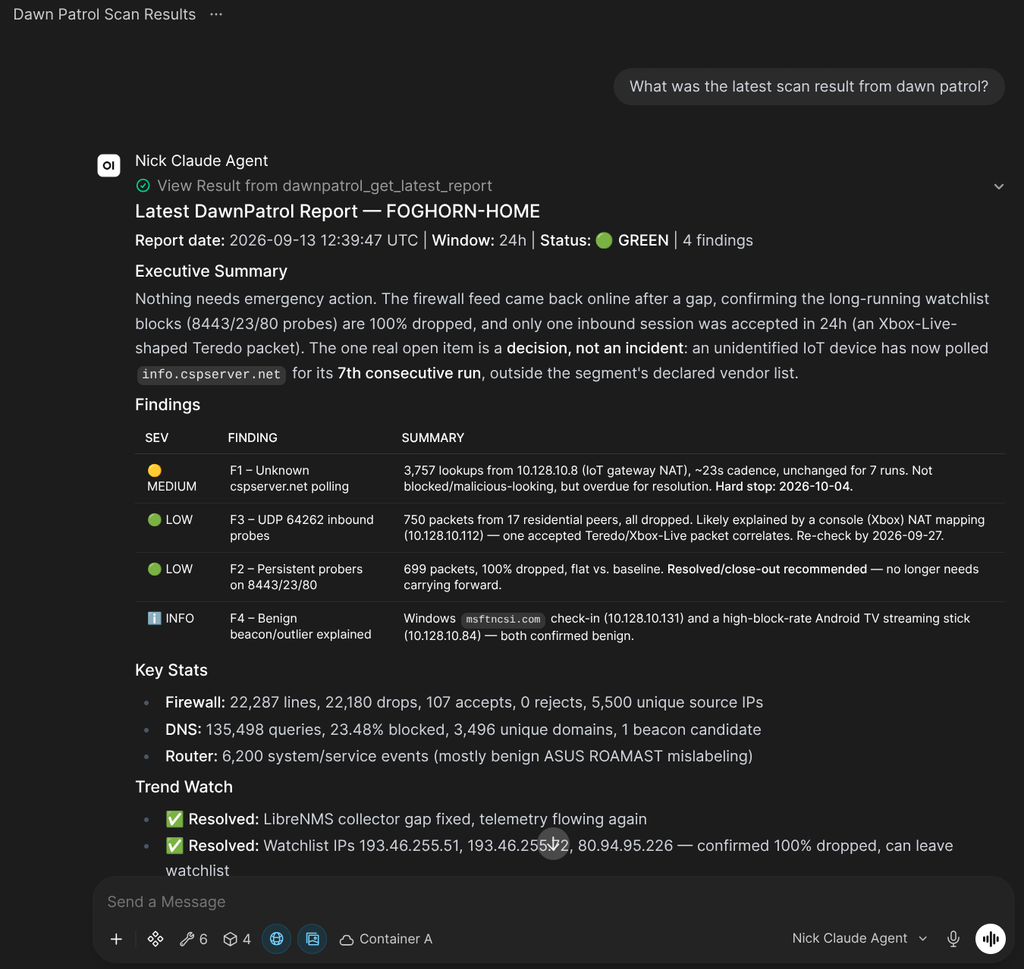
First up, it pulled the right report information and gave me a correct synopsis right away. I had trend information, findings data, and the piece of information I wanted to track down right at the top. There was the inbound connection, ostensibly an Xbox network packet, listed as F3 in the list.
I asked the agent to dig deeper.
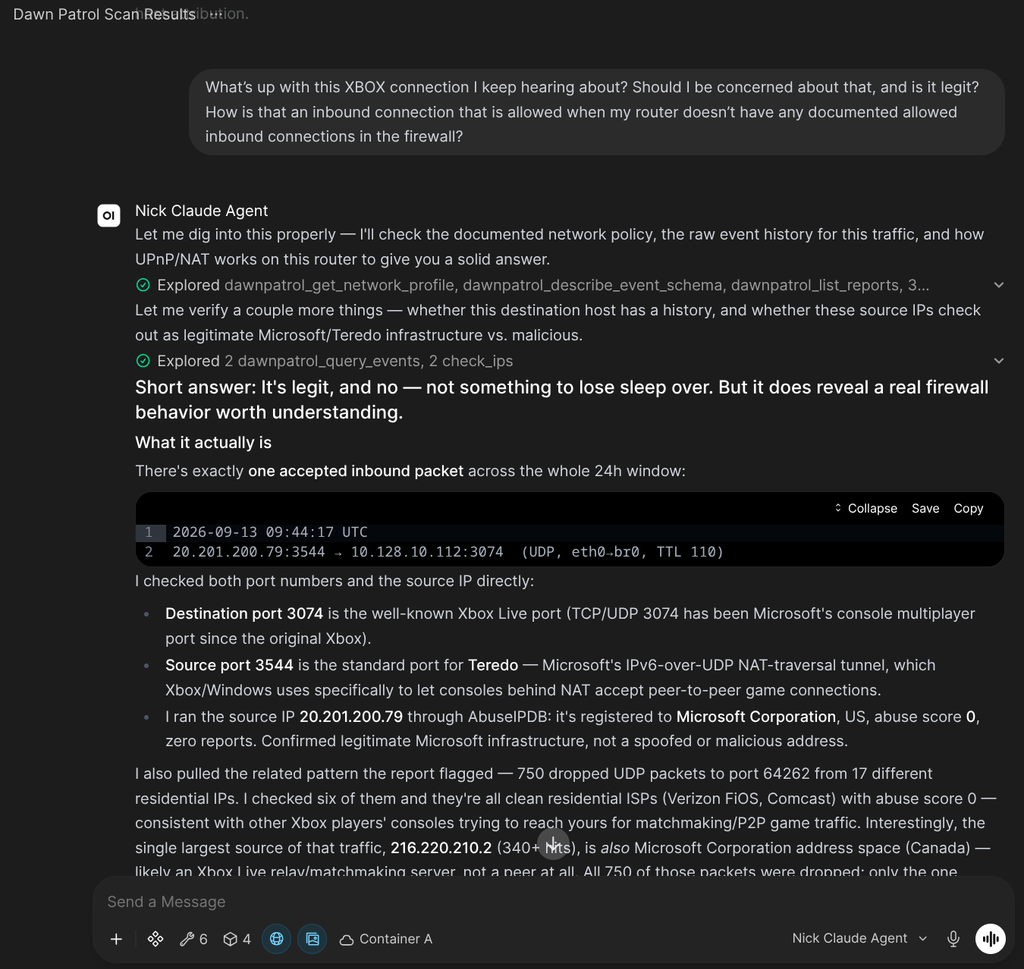
It leveraged the MCP on DawnPatrol to do a deeper analysis, looking at the specific IP address in question and correlating any relevant events. It also used the IP reputation tool that I had provided as part of the configuration to get additional details about the IP address in question from AbuseIP. In the end, with minimal prompting, it was able to give me a response and a result that I would happily accept from any SOC analyst worth their salt.
Not bad for half a day’s work.